Overview
Traces give you a transparent view into how your agents think, act, and collaborate inside the AgentSpace. They show what happens under the hood during a workflow run, which agents were called, what tools they used, how long each step took, and how many credits were consumed. The Trace Explorer is built directly into the AgentSpace and Playground so you can debug and optimize your workflows in real time.Viewing Traces in the Playground
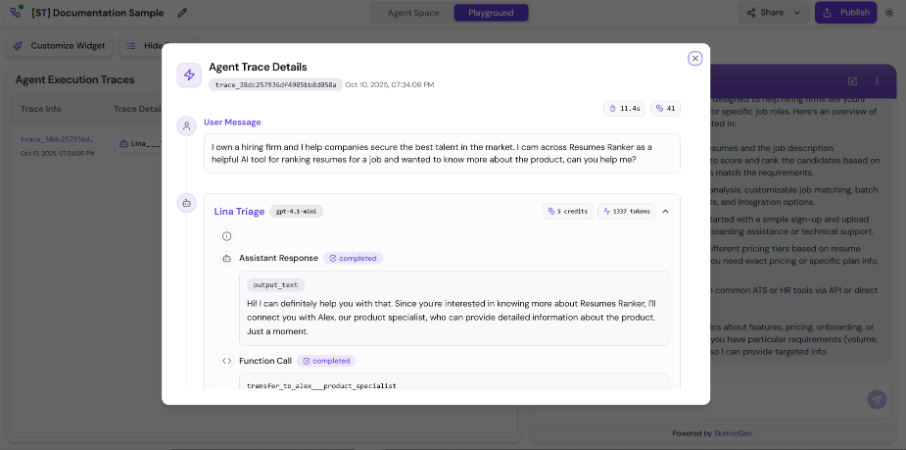
When testing your workflow in the Playground, each message execution is automatically logged with a corresponding trace record. You can open and explore these traces to see exactly how your agents responded to user input. Each trace provides:- The entry agent that first received the message.
- Any handoffs made between agents.
- Detailed function calls (tool invocations or agent transfers).
- The time taken and credits consumed per step.
- A complete breakdown of each agent’s reasoning and outputs.
- The function arguments or structured data passed downstream.
- The structured outputs produced.
- The exact handoff path followed during orchestration.
Trace Explorer in the AgentSpace
Within the AgentSpace, traces are tied to workflow executions and can be accessed after running a test. When a workflow is executed:- Each tool call, handoff, and agent decision is captured as a trace event.
- You can open the Trace Explorer to view the complete sequence of actions.
- Every trace displays execution metrics — including agent runtime, tool latency, and credit cost.
- Which agent initiated and completed each step.
- The order and duration of handoffs.
- How structured inputs and outputs flowed between nodes.
- Any failed or retried tool calls.
Optimization Quick Wins
Once you’ve reviewed your traces, you can apply these best practices to improve performance and reliability.- Tighten agent instructions — define when to call each tool and what success looks like.
- Use Agent-as-Tool for recurring, contained subtasks (classification, summarization, extraction).
- Prefer Structured Outputs to avoid parsing errors and reduce retry loops.
- Configure tool retries and fallbacks for fragile or rate-limited integrations.
- Keep sensitive credentials in vaults; redact or mask fields in traces.
- Cache results from heavy lookups to minimize unnecessary tool calls.
- Review Trace Explorer regularly to identify latency sources or redundant operations.
- Simplify orchestration paths — fewer handoffs improve both speed and cost efficiency.